Tenneco Reports Fourth Quarter And Full-Year 2018 Results
- Reported higher fourth quarter and full-year revenue on strong growth with light vehicle and commercial truck and off-highway customers
- Completed acquisition of Federal-Mogul on October 1, 2018
- On track to achieve acquisition synergy goals
Lake Forest, Illinois, March 14, 2019 – Tenneco (NYSE: TEN) reported a fourth quarter net loss of $109 million, or $(1.35) per diluted share. Fourth quarter 2017 net income▲ was $62 million, or $1.19 per diluted share. Adjusted net income was $105 million, or $1.30 per diluted share, versus $91 million or $1.75 per diluted share last year.▲
Fourth Quarter Results
Revenue▲
Total revenue in the fourth quarter was $4.3 billion, up 79% year-over-year, driven mainly by the completion of the Federal-Mogul acquisition on October 1, 2018. Excluding the acquisition and on a constant currency basis, revenue increased 4%, outpacing light vehicle industry production*by 10 percentage points. The outperformance was driven by volume and content growth with commercial truck and off-highway as well as light vehicle customers. Including Federal-Mogul results, value-add revenue was $3.6 billion, up more than 100% compared to last year.
“Tenneco’s strong organic growth continued in the fourth quarter, outpacing industry production by ten percentage points, enabled by our diverse business profile in terms of products, geographic regions and end-markets served,” said Brian Kesseler, Tenneco co-CEO. “We closed the Federal-Mogul transaction, accelerating the transformation of the combined businesses into two purpose-built, industry leading companies, and our acquisition of Öhlins will fuel the growth of advanced suspension technology and enhance our portfolio in broader mobility markets.”
Adjusted fourth quarter 2018 and 2017 results▲
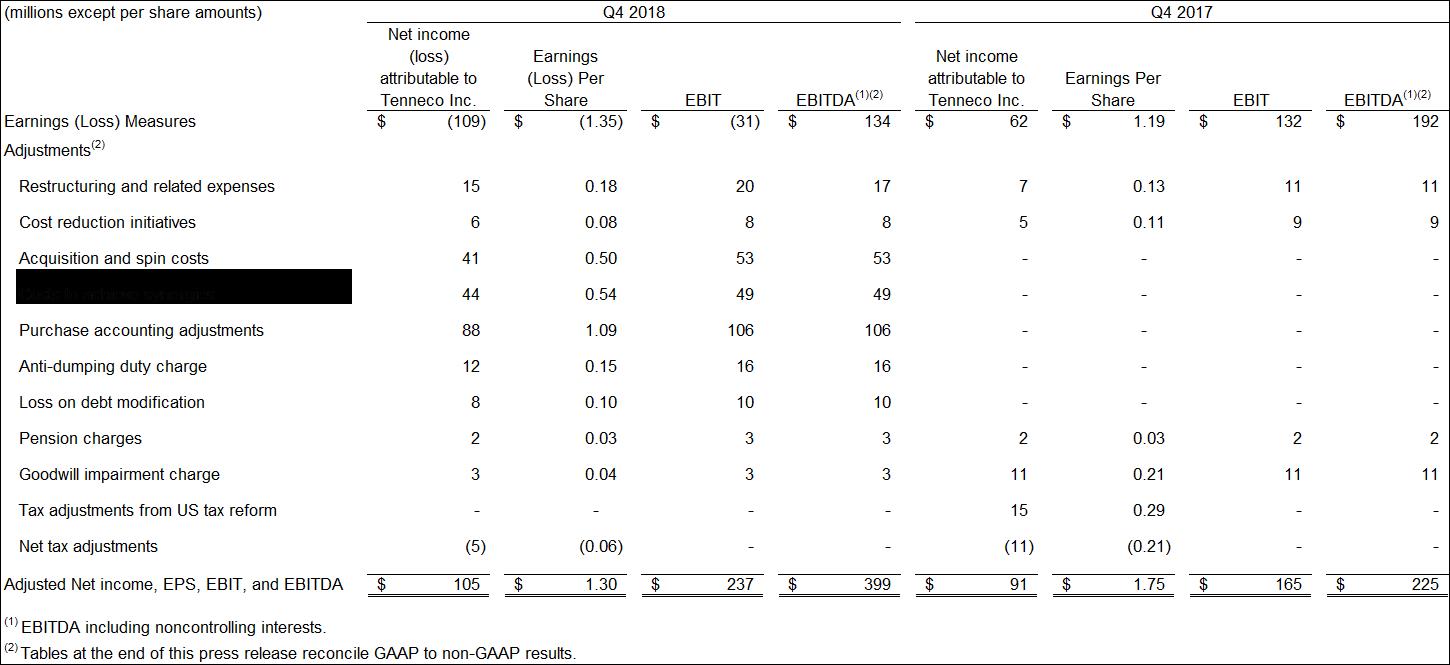
Earnings▲
Fourth quarter EBIT (earnings before interest and taxes) was a loss of $31 million, primarily due to restructuring expenses and costs associated with the acquisition and expected spin. EBITDA** (earnings before interest, taxes, noncontrolling interests, depreciation and amortization) was $134 million, versus $192 million a year ago. Adjusted EBITDA increased 77% to $399 million compared with $225 million last year, driven by the completion of the Federal-Mogul acquisition.
|
|
Q4 2018 | Q4 2017 | ||
| EBIT as a percent of revenue | -0.7% | 5.5% | ||
| EBITDA as a percent of revenue | 3.1% | 8.0% | ||
| EBITDA as a percent of value-add revenue | 3.7% | 10.6% | ||
| Adjusted EBITDA as a percent of revenue | 9.3% | 9.4% | ||
| Adjusted EBITDA as a percent of value-add revenue | 10.9% | 12.4% | ||
Cash
Cash generated by operations in the quarter was $402 million, versus $431 million last year.
During the quarter, the company returned $20 million to shareholders through a dividend payment of 25-cents per share.
(**Including noncontrolling interests )
Full-Year Results
Adjusted full year 2018 and 2017 results▲
Revenue▲
For the full year, total revenue was a record high $11.8 billion, including Federal-Mogul revenues since October 1. Excluding the acquisition and the impact of currency exchange rates, Tenneco delivered full-year organic revenue growth of 6%, outpacing industry production*by 7 percentage points, driven by 24% growth in commercial truck and off-highway and 5% light vehicle growth versus last year. Including Federal-Mogul results, value-add revenue was $9.3 billion, up 31% compared to last year.
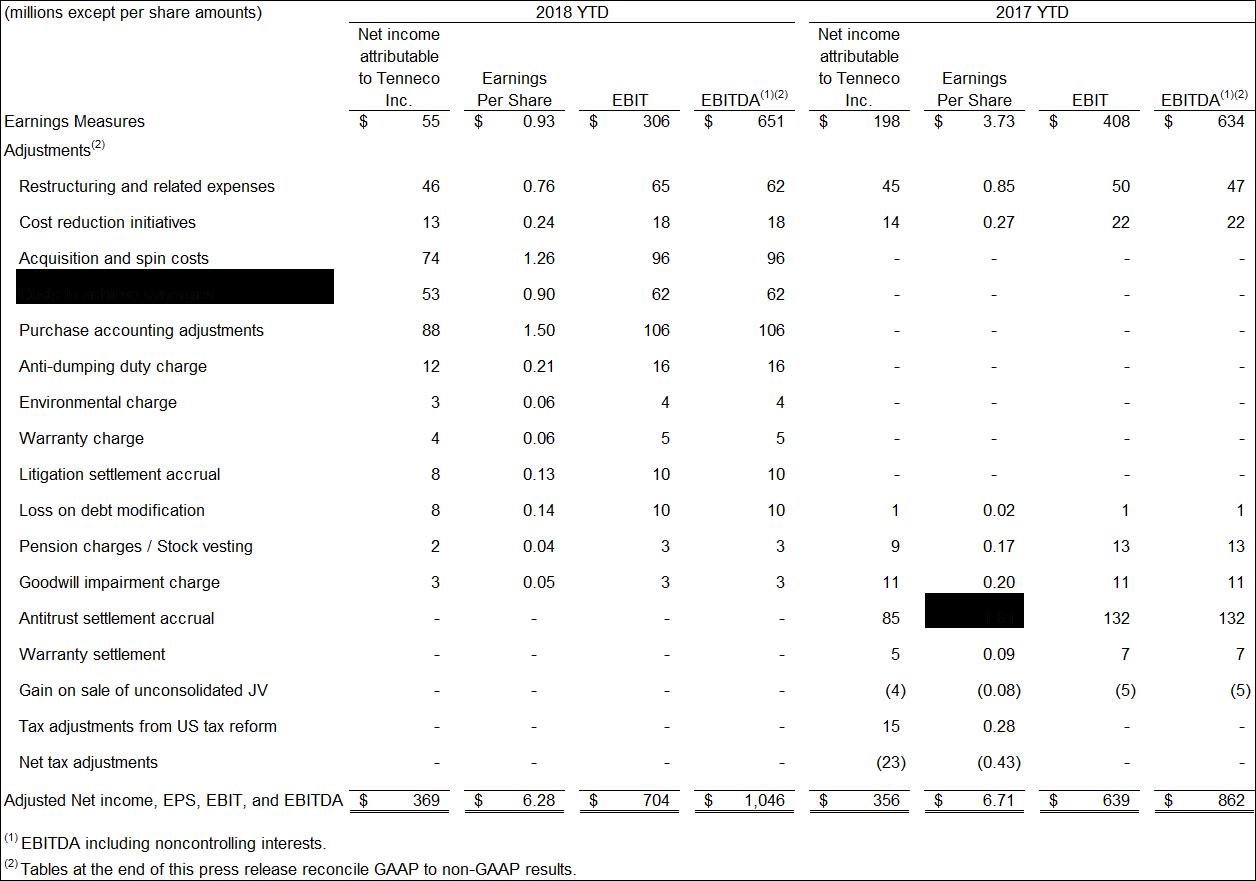
Earnings▲
Full-year EBIT was $306 million, versus EBIT of $408 million a year ago. EBITDA** was $651 million, versus $634 million a year ago. Adjusted EBITDA increased 21% to $1,046 million.
|
|
2018 | 2017 | ||
| EBIT as a percent of revenue | 2.6% | 4.4% | ||
| EBITDA as a percent of value-add revenue | 5.5% | 6.8% | ||
| EBITDA as a percent of value-add revenue | 7.0% | 8.9% | ||
| Adjusted EBITDA as a percent of revenue | 8.9% | 9.3% | ||
| Adjusted EBITDA as a percent of value-add revenue | 11.3% | 12.2% | ||
(**Including noncontrolling interests )
Cash
Cash generated by operations for the full year was $439 million, compared with $517 million last year.
In 2018, the company returned $59 million to shareholders through quarterly dividend payments of 25-cents per share.
OUTLOOK
Full year 2019
2019 revenue is expected in the range of $18.2 billion to $18.4 billion. On a pro forma basis the company expects constant dollar revenue growth in the range of 4% to 5%, outpacing light vehicle industry production*by 6 to 7 percentage points. Global light vehicle production is forecast to be down 2% in 2019. For the segments that will comprise the New Tenneco, we expect pro forma constant dollar revenue growth in the range of 6% to 7%, and for DRiV™ segments we anticipate pro forma constant dollar revenue growth of approximately 1%. We anticipate currency to have a negative 2% year-over-year impact on 2019 revenue.
2019 Financial Outlook Summary
|
Revenue |
$18.2 billion to $18.4 billion |
|
VA adjusted EBITDA** margin |
~Flat |
|
Interest expense |
$300 million to $320 million |
|
Full year effective tax rate |
28% to 30% |
|
Cash taxes |
$190 million to $220 million |
|
Capital expenditures |
$730 million to $780 million |
|
Depreciation and amortization |
~$635 million |
|
Substrate revenue |
~$2.8 billion |
First quarter 2019
On a pro forma basis, the company expects constant dollar revenue to be about even with last year, outpacing a forecasted light vehicle production decline of 6% in the first quarter.
“In 2019, we expect continued revenue growth that outpaces global industry production, powered by diverse and sustainable growth drivers across our business,” said Roger Wood, Tenneco co-CEO. “Our global teams are executing well against the integration plans and are on track to fully achieve our financial synergy targets for earnings and working capital.”
*Source: IHS Markit February 2019 global light vehicle production forecast and Tenneco estimates.
▲ Year-over-year revenue and earnings comparisons reflect revisions to prior period financial results for certain immaterial errors relating to capitalization of certain SG&A costs into inventory that did not constitute inventoriable costs, capitalization related to construction-in-process, estimation of warranty and rebate liabilities, and currency on certain non-income tax transactions. Further information will be provided in Tenneco’s Form 10-K for the year ended December 31, 2018.
Click here to download the release and the attachments listed below.
Attachment 1
Statements of Income – 3 Months
Statements of Income – 12 Months
Balance Sheets
Statements of Cash Flows – 3 Months
Statements of Cash Flows – 12 Months
Attachment 2
Reconciliation of GAAP Net Income to EBITDA including noncontrolling interests – 3 Months
Reconciliation of GAAP to Non-GAAP Earnings Measures – 3 Months
Reconciliation of GAAP Net Income to EBITDA including noncontrolling interests – 12 Months
Reconciliation of GAAP to Non-GAAP Earnings Measures – 12 Months
Reconciliation of GAAP Revenue to Non-GAAP Revenue Measures – 3 Months
Reconciliation of GAAP Revenue to Non-GAAP Revenue Measures – 12 Months
Reconciliation of GAAP Revenue to Non-GAAP Revenue Measures – 3 Months and 12 Months
Reconciliation of Non-GAAP Measures – Debt Net of Cash/Adjusted LTM and pro forma adjusted LTM EBITDA including noncontrolling interests
Reconciliation of GAAP Revenue to Non-GAAP Revenue Measures – Original Equipment and Aftermarket Revenue – 3 Months and 12 Months
Reconciliation of GAAP Revenue and Earnings to Non-GAAP Revenue and Earnings Measures – 3 Months
Reconciliation of GAAP Revenue and Earnings to Non-GAAP Revenue and Earnings Measures – 12 Months
Reconciliation of GAAP Revenue to Non-GAAP Revenue Measures – Original Equipment Commercial Truck, Off-Highway and other revenues – quarterly and annual.
Reconciliation of GAAP Revenue to pro forma Revenue and Earnings Measures – full year 2017 and 2018, quarterly 2018.
CONFERENCE CALL
The company will host a conference call on Thursday, March 14, 2019 at 9:00 a.m. ET. The dial-in number is 833-366-1121 (domestic) or 412-902-6733 (international). The passcode is: Tenneco Inc. The call and accompanying slides will be available on the financial section of the Tenneco web site at www.investors.tenneco.com. A recording of the call will be available one hour following completion of the call on March 14, 2019 through March 21, 2019. To access this recording, dial 877-344-7529 (domestic) or 412-317-0088 (international) or (855) 669-9658 (Canada). The replay access code is 10129530. The purpose of the call is to discuss the company’s operations for the last fiscal quarter and year ending 2018, as well as provide updated information regarding matters impacting the company’s outlook. A copy of the press release is available on the financial and news sections of the Tenneco web site.
ANNUAL MEETING
The Tenneco Board of Directors has scheduled the company’s annual meeting of shareholders for Wednesday, May 15, 2019 at 1:00 p.m. ET. The meeting will be held at the Detroit Foundation Hotel, 250 W Larned Street, Detroit, Michigan. The record date for shareholders eligible to vote at the meeting is March 18, 2019.
About Tenneco
Headquartered in Lake Forest, Illinois, Tenneco is one of the world’s leading designers, manufacturers and marketers of Aftermarket, Ride Performance, Clean Air and Powertrain products and technology solutions for diversified markets, including light vehicle, commercial truck, off-highway, industrial and the aftermarket, with 2018 revenues of $11.8 billion and approximately 81,000 employees worldwide. On October 1, 2018, Tenneco completed the acquisition of Federal-Mogul, a leading global supplier to original equipment manufacturers and the aftermarket. Additionally, the company expects to separate its businesses to form two new, independent companies, an Aftermarket and Ride Performance company as well as a new Powertrain Technology company, in the second half of 2019.
About DRiV™ - the future Aftermarket and Ride Performance Company
Following the separation, DRiV will be one of the largest global multi-line, multi-brand aftermarket companies, and one of the largest global OE ride performance and braking companies. DRiV’s principal product brands will feature Monroe®, Öhlins®, Walker®, Clevite®Elastomers, MOOG®, Fel-Pro®, Wagner®, Ferodo®, Champion® and others. DRiV would have 2018 pro-forma revenues of $6.4 billion, with 54% of those revenues from aftermarket and 46% from original equipment customers.
About the new Tenneco - the future Powertrain Technology Company
Following the separation, the new Tenneco will be one of the world’s largest pure-play powertrain companies serving OE markets worldwide with engineered solutions addressing fuel economy, power output, and criteria pollution requirements for gasoline, diesel and electrified powertrains. The new Tenneco would have 2018 pro-forma revenues of $11.4 billion, serving light vehicle, commercial truck, off-highway and industrial markets.
Revenue estimates and other forecasted information in this release are based on OE manufacturers’ programs that have been formally awarded to the company; programs where Tenneco is highly confident that it will be awarded business based on informal customer indications consistent with past practices; and Tenneco’s status as supplier for the existing program and its relationship with the customer. This information is also based on anticipated vehicle production levels and pricing, including precious metals pricing and the impact of material cost changes. Unless otherwise indicated, our methodology does not attempt to forecast currency fluctuations, and accordingly, reflects constant currency. Certain elements of the restructuring and related expenses, legal settlements and other unusual charges we incur from time to time cannot be forecasted accurately. In this respect, we are not able to forecast EBIT or EBITDA (and the related margins) on a forward-looking basis without unreasonable efforts on account of these factors and the difficulty in predicting GAAP revenues (for purposes of a margin calculation) due to variability in production rates and volatility of precious metal pricing in the substrates that we pass through to our customers. For certain additional assumptions upon which these estimates are based, see the slides accompanying the March 14, 2019 webcast, which will be available on the financial section of the Tenneco website at www.investors.tenneco.com.
This press release contains forward-looking statements. The words “may,” “will,” “believe,” “should,” “could,” “plan,” “expect,” “anticipate,” “estimate,” and similar expressions (and variations thereof), identify these forward-looking statements. These forward-looking statements are based on the current expectations of the company (including its subsidiaries). Because these statements involve risks and uncertainties, actual results may differ materially from the expectations expressed in the forward-looking statements. Important factors that could cause actual results to differ materially from the expectations reflected in the forward-looking statements include:
• general economic, business and market conditions;
• our ability to source and procure needed materials, components and other products and services in accordance with customer demand and at competitive prices;
• the cost and outcome of existing and any future claims, legal proceedings or investigations, including, but not limited to, any of the foregoing arising in connection with the ongoing global antitrust investigation, product performance, product safety or intellectual property rights;
• changes in consumer demand, prices and our ability to have our products included on top selling vehicles, including any shifts in consumer preferences away from historically higher margin products for our customers and us, to other lower margin vehicles, for which we may or may not have supply arrangements, and the cyclical nature of the global vehicle industry, including the performance of the global aftermarket sector and the impact of vehicle parts' longer product lives;
• changes in consumer demand for our OE or aftermarket products, or changes in automotive and commercial vehicle manufacturers’ production rates and their actual and forecasted requirements for our products, due to difficult economic conditions and/or regulatory or legal changes affecting internal combustion engines and/or aftermarket products;
• our dependence on certain large customers, including the loss of any of our large original equipment manufacturer (“OE”) customers (on whom we depend for a substantial portion of our revenues), or the loss of market shares by these customers if we are unable to achieve increased sales to other OE customers or any change in customer demand due to delays in the adoption or enforcement of worldwide emissions regulations;
• new technologies that reduce the demand for certain of our products or otherwise render them obsolete;
• our ability to introduce new products and technologies that satisfy customers' needs in a timely fashion;
• the overall highly competitive nature of the automotive and commercial vehicle parts industries, and any resultant inability to realize the sales represented by our awarded book of business (which is based on anticipated pricing and volumes over the life of the applicable program);
• changes in capital availability or costs, including increases in our cost of borrowing (i.e., interest rate increases), the amount of our debt, our ability to access capital markets at favorable rates, and the credit ratings of our debt;
• our ability to comply with the covenants contained in our debt instruments;
• our working capital requirements;
• our ability to successfully execute cash management and other cost reduction plans, and to realize the anticipated benefits from these plans;
• risks inherent in operating a multi-national company, including economic conditions, such as currency exchange and inflation rates, and political conditions in the countries where we operate or sell our products, adverse changes in trade agreements, tariffs, immigration policies, political stability, and tax and other laws, and potential disruptions of production and supply;
• increasing competition from lower cost, private-label products;
• damage to the reputation of one or more of our leading brands;
• the impact of improvements in automotive parts on aftermarket demand for some of our products;
• industrywide strikes, labor disruptions at our facilities or any labor or other economic disruptions at any of our significant customers or suppliers or any of our customers’ other suppliers;
• developments relating to our intellectual property, including our ability to changes in technology;
• costs related to product warranties and other customer satisfaction actions;
• the failure or breach of our information technology systems, including the consequences of any misappropriation, exposure or corruption of sensitive information stored on such systems and the interruption to our business that such failure or breach may cause;
• the impact of consolidation among vehicle parts suppliers and customers on our ability to compete in the highly competitive automotive and commercial vehicle supplier industry;
• changes in distribution channels or competitive conditions in the markets and countries where we operate;
• the evolution towards autonomous vehicles and car and ride sharing;
• customer acceptance of new products;
• our ability to successfully integrate, and benefit from, any acquisitions that we complete;
• our ability to effectively manage our joint ventures and other third-party relationships;
• the potential impairment in the carrying value of our long-lived assets and goodwill or our deferred tax assets;
• the negative impact of fuel price volatility on transportation and logistics costs, raw material costs, discretionary purchases of vehicles or aftermarket products and demand for off-highway equipment;
• increases in the costs of raw materials or components, including our ability to successfully reduce the impact of any such cost increases through materials substitutions, cost reduction initiatives, customer recovery and other methods;
• changes by the Financial Accounting Standards Board or the Securities and Exchange Commission of authoritative generally accepted accounting principles or policies;
• changes in accounting estimates and assumptions, including changes based on additional information;
• any changes by the International Organization for Standardization (ISO) or other such committees in their certification protocols for processes and products, which may have the effect of delaying or hindering our ability to bring new products to market;
• the impact of the extensive, increasing and changing laws and regulations to which we are subject, including environmental laws and regulations, which may result in our incurrence of environmental liabilities in excess of the amount reserved or increased costs or loss of revenues relating to products subject to changing regulation;
• potential volatility in our effective tax rate;
• disasters, such as fires, earthquakes and flooding, and any resultant disruptions in the supply or production of goods or services to us or by us, in demand by our customers or in the operation of our system, disaster recovery capabilities or business continuity capabilities;
• acts of war and/or terrorism, as well as actions taken or to be taken by the United States and other governments as a result of further acts or threats of terrorism, and the impact of these acts on economic, financial and social conditions in the countries where we operate;
• pension obligations and other postretirement benefits;
• our hedging activities to address commodity price fluctuations; and
• the timing and occurrence (or non-occurrence) of other transactions, events and circumstances which may be beyond our control.
In addition, important factors related to the acquisition of Federal-Mogul LLC ("Federal-Mogul") and the planned separation of our company into a powertrain technology company and an aftermarket and ride performance company that could cause actual results to differ materially from the expectations reflected in the forward-looking statements, including:
• the risk that the benefits of the acquisition of Federal-Mogul, including synergies, may not be fully realized or may take longer to realize than expected;
• the risk that the acquisition of Federal-Mogul may not advance our business strategy;
• the risk that we may experience difficulty integrating or separating employees or operations;
• the risk that the transaction may have an adverse impact on existing arrangements with us, including those related to transition, manufacturing and supply services and tax matters, our ability to retain and hire key personnel or our ability to maintain relationships with customers, suppliers or other business partners;
• the risk that the company may not complete a separation of its powertrain technology business and its aftermarket and ride performance business (or achieve some or all of the anticipated benefits of such a separation);
• the risk that the combined company and each separate company following the spin-off will underperform relative to our expectations;
• the ongoing transaction costs and risk that we may incur greater costs following the spin-off; and
• the risk that the spin-off is determined to be a taxable transaction.
The company undertakes no obligation to update any forward-looking statement to reflect events or circumstances after the date of this press release. Additional information regarding these risk factors and uncertainties is, and will be, detailed from time to time in the company's SEC filings, including but not limited to its annual report on Form 10-K for the year ended December 31, 2018.
###
Investor inquiries:
Linae Golla
847-482-5162
lgolla@tenneco.com
Media inquiries:
Bill Dawson
847-482-5807
bdawson@tenneco.com
| Q4 2018 | Q4 2017 | |||
| EBIT as a percent of revenue | -0.7% | 5.5% | ||
| EBITDA as a percent of revenue | 3.1% | 8.0% | ||
| EBITDA as a percent of value-add revenue | 3.7% | 10.6% | ||
| Adjusted EBITDA as a percent of revenue | 9.3% | 9.4% | ||
| Adjusted EBITDA as a percent of value-add revenue | 10.9% | 12.4% | ||