Tenneco Reports Fourth Quarter And Full-Year 2016 Results
- Record fourth quarter and full-year revenue
- Record full-year EBIT, net income and earnings per share
- Repurchased 4.2 million shares of common stock in 2016
Lake Forest, Illinois, February 7, 2017 – Tenneco (NYSE: TEN) reported fourth quarter net income of $40 million, or $0.73 per diluted share, which includes an after-tax pension charge of $47 million. Fourth quarter 2015 net income was $68 million, or $1.17 per diluted share. Adjusted net income rose to $92 million, or $1.67 per diluted share, versus $80 million or $1.39 per diluted share last year.
Fourth Quarter Results
Revenue
Total revenue in the fourth quarter was $2.155 billion, up 6% year-over-year on stronger global light vehicle revenues, driven by both the Clean Air and Ride Performance product lines.
On a constant currency basis, total revenue increased 9% to $2.212 billion, driven by a 13% increase in light vehicle revenue, nearly doubling global light vehicle industry production growth of 7%. Tenneco’s fourth quarter OE commercial truck and off-highway revenues declined 7% year over year, remaining essentially even with the third quarter. The company’s global aftermarket revenue was up 1% versus a year ago. Value-add revenue increased 9% versus last year.
“We finished the year with a solid fourth quarter and another year of record results, with full-year total revenue again outpacing industry production,” said Gregg Sherrill, chairman and CEO, Tenneco. “We also continued to do an excellent job converting this top line growth to drive record-high earnings for 2016 and greater profitability with our seventh consecutive full year of value-add adjusted EBIT margin improvement.”
Adjusted fourth quarter 2016 and 2015 results
| Q4 2016 | Q4 2015 | |||||||||||||||||
| (millions except per share amounts) | EBITDA* | EBIT | Net income attributable to Tenneco Inc. | Per Share | EBITDA* | EBIT | Net income attributable to Tenneco Inc. | Per Share | ||||||||||
| Earnings Measures | $ | 128 | $ | 75 | $ | 40 | $ | 0.73 | $ | 177 | $ | 128 | $ | 68 | $ | 1.17 | ||
| Adjustments (reflects non-GAAP measures): | ||||||||||||||||||
| Restructuring and related expenses | 9 | 10 | 9 | 0.18 | 16 | 16 | 15 | 0.26 | ||||||||||
| Pension Charges | 72 | 72 | 47 | 0.85 | 4 | 4 | 3 | 0.05 | ||||||||||
| Net tax adjustments | - | - | (4) | (0.09) | - | - | (6) | (0.09) | ||||||||||
| Non-GAAP earnings measures | $ | 209 | $ | 157 | $ | 92 | $ | 1.67 | $ | 197 | $ | 148 | $ | 80 | $ | 1.39 | ||
EBIT and EBIT Margin
Fourth quarter EBIT (earnings before interest, taxes and noncontrolling interests) was $75 million, versus $128 million last year. Adjusted EBIT rose 6% to $157 million, a fourth quarter record.
Tenneco EBIT as a percent of revenue was 3.5%, which included a pre-tax pension charge of $72 million, and $10 million in restructuring and related expenses. Adjusted EBIT as a percent of value-add revenue was 9.6%, consistent with a strong performance a year ago.
Both EBIT and EBIT margin results continue to be driven by capitalizing on light vehicle growth in excess of industry production, technology content growth in both product lines, higher aftermarket sales and a continued focus on launch execution and manufacturing improvements. The year over year comparison includes $10 million in negative currency.
Fourth quarter EBIT margin
|
|
Q4 2016 | Q4 2015 | ||
| EBIT as a percent of revenue | 3.5% | 6.3% | ||
| EBIT as a percent of value-add revenue | 4.6% | 8.3% | ||
| Adjusted EBIT as a percent of revenue | 7.3% | 7.3% | ||
| Adjusted EBIT as a percent of value-add revenue | 9.6% | 9.6% | ||
Full-Year Results
Adjusted full year 2016 and 2015 results
| 2016 | 2015 | |||||||||||||||||
| (millions except per share amounts) | EBITDA* | EBIT | Net income attributable to Tenneco Inc. | Per Share | EBITDA* | EBIT | Net income attributable to Tenneco Inc. | Per Share | ||||||||||
| Earnings Measures | $ | 740 | $ | 528 | $ | 363 | $ | 6.44 | $ | 722 | $ | 519 | $ | 247 | $ | 4.11 | ||
| Adjustments (reflects non-GAAP measures): | ||||||||||||||||||
| Restructuring and related expenses | 32 | 36 | 32 | 0.57 | 59 | 63 | 58 | 0.96 | ||||||||||
| Pension charges | 72 | 72 | 47 | 0.83 | 4 | 4 | 3 | 0.05 | ||||||||||
| Costs related to refinancing | - | - | 15 | 0.27 | - | - | - | - | ||||||||||
| Net tax adjustments | - | - | (110) | (1.96) | - | - | (15) | (0.25) | ||||||||||
| Non-GAAP earnings measures | $ | 844 | $ | 636 | $ | 347 | $ | 6.15 | $ | 785 | $ | 586 | $ | 293 | $ | 4.87 | ||
Revenue
For the full year, total revenue was $8.599 billion. In constant currency, revenue increased 7% to $8.819 billion.
Revenue growth was driven by a 10% increase in light vehicle revenue and a 2% increase in aftermarket sales. Commercial truck and off-highway revenue was down 4%, which included a 2% increase in Clean Air revenue due to incremental content growth, offset by lower Ride Performance revenue due to weak commercial truck industry production and the sale of the Marzocchi specialty business.
EBIT and EBIT margin
Full-year EBIT increased to $528 million, versus $519 million a year ago. Adjusted EBIT rose 9% to $636 million.
EBIT as a percent of revenue was 6.1%. Adjusted EBIT as a percent of value-add revenue was 9.7%, up 40 basis points versus a year ago.
Improvements in EBIT and adjusted EBIT were driven by incremental Clean Air content on light vehicle and commercial truck programs, Monroe Intelligent Suspension revenue growth, higher global aftermarket sales, leveraging higher light vehicle volumes globally and ongoing operational improvements. The year-over-year comparison includes $33 million in negative currency.
|
|
2016 | 2015 | ||
| EBIT as a percent of revenue | 6.1% | 6.3% | ||
| EBIT as a percent of value-add revenue | 8.0% | 8.2% | ||
| Adjusted EBIT as a percent of revenue | 7.4% | 7.1% | ||
| Adjusted EBIT as a percent of value-add revenue | 9.7% | 9.3% | ||
Cash
Cash generated by operations in the fourth quarter was $250 million, compared with $329 million in fourth quarter 2015. For the full year, cash generated by operations was $489 million, down from $517 million a year ago, due to the timing of revenue growth at the end of the year and the resulting impact on accounts receivable.
During the quarter the company repurchased approximately 1.4 million shares of common stock for $79 million. For the full year, the company repurchased a total of 4.2 million shares for $225 million.
Tenneco continues to invest in growth with total capital spending in 2016 of $343 million, primarily for new programs in Europe, North America and China.
OUTLOOK
(Note: all forward looking revenue estimates reflect constant currency.)
First quarter 2017
Tenneco expects total revenue growth of 7% in the first quarter 2017, outpacing forecasted light vehicle industry production* growth of 3%. The company expects to better the industry with 4% organic growth, driven by incremental content to meet Tier 3 and Euro 6 emissions regulations, the ramp up of recently launched programs and Tenneco’s strong position on light vehicle platforms globally. Tenneco also expects a slight increase in commercial truck and off-highway revenues and a solid contribution from the global aftermarket. The company anticipates a currency headwind in the first quarter of approximately 2% based on current exchange rates.
Full year 2017
The company expects total revenue growth to outpace light vehicle industry production by 4 percentage points, resulting in 5% growth in 2017 driven by:
- An outstanding position on light vehicle platforms globally;
- Regulatory-driven Clean Air content;
- Increasing demand for advanced suspension systems, and;
- Tenneco’s global aftermarket leadership.
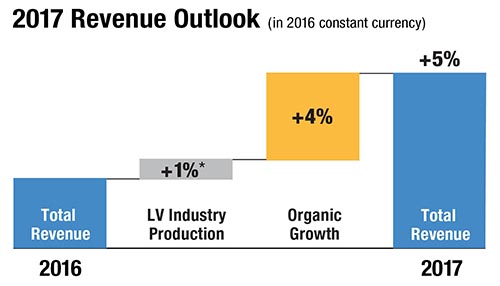
The company’s revenue growth estimate assumes light vehicle industry production growth* of 1%, global commercial truck production** growth of about 2%, and growth in off-highway engine production** in regulated regions (North America and Europe) of about 2%.
In 2018 and 2019, Tenneco expects continued revenue growth, outpacing industry production by 3 to 5 percentage points each year.
“Tenneco has exceptional growth opportunities, powered by sustainable growth drivers and outstanding balance in terms of product lines, end markets, geographic regions and customers we serve,” said Sherrill. “In 2017, we expect to build on our track record of growth and continue our annual margin expansion with regulatory-driven Clean Air content growth, increased penetration of our Monroe Intelligent Suspension technology, disciplined launch execution and a relentless focus on continuous operational improvements.”
In 2017, Tenneco expects:
- Capital expenditures between $360 million and $390 million;
- Annual interest expense of about $70 million;
- Cash taxes between $125 million and $140 million;
- Full year tax rate between 29% and 31%.
*IHS Automotive January 2017 global light vehicle production and Tenneco estimates.
**Power Systems Research January 2017 global commercial truck and bus production, PSR off-highway engine production in North America and Europe, and Tenneco estimates.
Click here to download Q4 2016 release including all attachments listed below
Attachment 1
Statements of Income – 3 Months
Statements of Income – 12 Months
Balance Sheets
Statements of Cash Flows – 3 Months
Statements of Cash Flows – 12 Months
Attachment 2
Reconciliation of GAAP Net Income to EBITDA including noncontrolling interests – 3 Months
Reconciliation of GAAP to Non-GAAP Earnings Measures – 3 Months
Reconciliation of GAAP Net Income to EBITDA including noncontrolling interests – 12 Months
Reconciliation of GAAP to Non-GAAP Earnings Measures – 12 Months
Reconciliation of GAAP Revenue to Non-GAAP Revenue Measures – 3 Months
Reconciliation of GAAP Revenue to Non-GAAP Revenue Measures – 12 Months
Reconciliation of GAAP Revenue to Non-GAAP Revenue Measures – 3 Months and 12 Months
Reconciliation of Non-GAAP Measures – Debt Net of Cash/Adjusted LTM EBITDA including noncontrolling interests
Reconciliation of GAAP Revenue to Non-GAAP Revenue Measures – Original Equipment and Aftermarket Revenue – 3 Months and 12 Months
Reconciliation of GAAP Revenue and Earnings to Non-GAAP Revenue and Earnings Measures – 3 Months
Reconciliation of GAAP Revenue and Earnings to Non-GAAP Revenue and Earnings Measures – 12 Months
Reconciliation of GAAP Revenue and Earnings to Non-GAAP Revenue and Earnings Measures – adjusted EBIT as a percentage of value-add revenue – Annual
Reconciliation of GAAP Revenue to Non-GAAP Revenue Measures – Original Equipment Commercial Truck, Off-Highway and other revenues – 3 Months and 12 Months
CONFERENCE CALL
The company will host a conference call on Tuesday, February 7, 2017 at 9:00 a.m. ET. The dial-in number is 888-989-6519 (domestic) or 630-395-0180 (international). The passcode is TENNECO. The call and accompanying slides will be available on the financial section of the Tenneco web site at www.investors.tenneco.com. A recording of the call will be available one hour following completion of the call on February 7, 2016 through March 7, 2017. To access this recording, dial 888-568-0148 (domestic) or 203-369-3900 (international). The purpose of the call is to discuss the company’s operations for last fiscal quarter and year ending 2016, as well as provide updated information regarding matters impacting the company’s outlook. A copy of the press release is available on the financial and news sections of the Tenneco web site.
ANNUAL MEETING
The Tenneco Board of Directors has scheduled the corporation’s annual meeting of shareholders for Wednesday, May 17, 2017 at 10:00 a.m. CT. The meeting will be held at the corporate headquarters, 500 North Field Drive, Lake Forest, Illinois. The record date for shareholders eligible to vote at the meeting is March 20, 2017.
Tenneco is an $8.6 billion global manufacturing company with headquarters in Lake Forest, Illinois and approximately 31,000 employees worldwide. Tenneco is one of the world’s largest designers, manufacturers and marketers of clean air and ride performance products and systems for automotive and commercial vehicle original equipment markets and the aftermarket. Tenneco’s principal brand names are Monroe®, Walker®, XNOx™ and Clevite®Elastomer.
Revenue estimates in this release are based on OE manufacturers’ programs that have been formally awarded to the company; programs where Tenneco is highly confident that it will be awarded business based on informal customer indications consistent with past practices; and Tenneco’s status as supplier for the existing program and its relationship with the customer. These revenue estimates are also based on anticipated vehicle production levels and pricing, including precious metals pricing and the impact of material cost changes. Unless otherwise indicated, our revenue estimate methodology does not attempt to forecast currency fluctuations, and accordingly, reflects constant currency. For certain additional assumptions upon which these estimates are based, see the slides accompanying the February 7, 2017 webcast, which will be available on the financial section of the Tenneco website at www.investors.tenneco.com.
This press release contains forward-looking statements. Words such as “may,” “expects,” “anticipate,” “projects,” “will,” “outlook” and similar expressions identify forward-looking statements. These forward-looking statements are based on the current expectations of the company (including its subsidiaries). Because these forward-looking statements involve risks and uncertainties, the company's plans, actions and actual results could differ materially. Among the factors that could cause these plans, actions and results to differ materially from current expectations are:
(i) general economic, business and market conditions;
(ii) the company’s ability to source and procure needed materials, components and other products and services in accordance with customer demand and at competitive prices;
(iii) the cost and outcome of existing and any future claims, legal proceedings, or investigations, including, but not limited to, any of the foregoing arising in connection with the ongoing global antitrust investigation, product performance, product safety or intellectual property rights;
(iv) changes in capital availability or costs, including increases in the company's costs of borrowing (i.e., interest rate increases), the amount of the company's debt, the ability of the company to access capital markets at favorable rates, and the credit ratings of the company’s debt;
(v) changes in consumer demand, prices and the company’s ability to have our products included on top selling vehicles, including any shifts in consumer preferences to lower margin vehicles, for which we may or may not have supply arrangements;
(vi) changes in automotive and commercial vehicle manufacturers' production rates and their actual and forecasted requirements for the company's products such as the significant production cuts during recent years by automotive manufacturers in response to difficult economic conditions;
(vii) the overall highly competitive nature of the automobile and commercial vehicle parts industries, and any resultant inability to realize the sales represented by the company’s awarded book of business which is based on anticipated pricing and volumes over the life of the applicable program;
(viii) the loss of any of our large original equipment manufacturer (“OEM”) customers (on whom we depend for a substantial portion of our revenues), or the loss of market shares by these customers if we are unable to achieve increased sales to other OEMs or any change in customer demand due to delays in the adoption or enforcement of worldwide emissions regulations;
(ix) the company's continued success in cost reduction and cash management programs and its ability to execute restructuring and other cost reduction plans, including our current cost reduction initiatives, and to realize anticipated benefits from these plans;
(x) economic, exchange rate and political conditions in the countries where we operate or sell our products;
(xi) workforce factors such as strikes or labor interruptions;
(xii) increases in the costs of raw materials, including the company’s ability to successfully reduce the impact of any such cost increases through materials substitutions, cost reduction initiatives, customer recovery and other methods;
(xiii) the negative impact of fuel price volatility on transportation and logistics costs, raw material costs, discretionary purchases of vehicles or aftermarket products, and demand for off-highway equipment;
(xiv) the cyclical nature of the global vehicular industry, including the performance of the global aftermarket sector and longer product lives of automobile parts;
(xv) product warranty costs;
(xvi) the failure or breach of our information technology systems and the consequences that such failure or breach may have to our business;
(xvii) the company's ability to develop and profitably commercialize new products and technologies, and the acceptance of such new products and technologies by the company's customers and the market;
(xviii) changes by the Financial Accounting Standards Board or other accounting regulatory bodies to authoritative generally accepted accounting principles or policies;
(xix) changes in accounting estimates and assumptions, including changes based on additional information;
(xx) the impact of the extensive, increasing and changing laws and regulations to which we are subject, including environmental laws and regulations, which may result in our incurrence of environmental liabilities in excess of the amount reserved;
(xxi) natural disasters, acts of war and/or terrorism and the impact of these occurrences or acts on economic, financial, industrial and social condition, including, without limitation, with respect to supply chains and customer demand in the countries where the company operates; and
(xxii) the timing and occurrence (or non-occurrence) of transactions and events which may be subject to circumstances beyond the control of the company and its subsidiaries.
The company undertakes no obligation to update any forward-looking statement to reflect events or circumstances after the date of this press release. Additional information regarding these risk factors and uncertainties is detailed from time to time in the company's SEC filings, including but not limited to its annual report on Form 10-K for the year ended December 31, 2015, and its quarterly report on Form 10-Q for the quarter ended September 30, 2016.
###
Investor inquiries:
Linae Golla
847-482-5162
lgolla@tenneco.com
Media inquiries:
Bill Dawson
847-482-5807
bdawson@tenneco.com
|
|
Q3 2016 | Q3 2015 | ||
| EBIT as a percent of revenue | 7.3% | 5.7% | ||
| EBIT as a percent of value-add revenue | 9.4% | 7.5% | ||
| Adjusted EBIT as a percent of revenue | 7.6% | 7.5% | ||
| Adjusted EBIT as a percent of value-add revenue | 9.9% | 9.7% | ||